
Are you ready to level up your data visualisation game? Creating a Percentage of Total field in Looker Studio is a valuable technique to highlight the relative contribution of data subsets and gain deeper insights into your data.
In this tutorial, we’ll show you how to effortlessly add a Percentage of Total field to your Data Studio reports, transforming your raw data into actionable visualisations.
Header Outline:
- I. Introduction
- II. Understanding Percentage of Total
- III. Creating a Field for Percentage of Total
- IV. Formatting and Customisation
- V. Analysing Data with Percentage of Total
- VI. Considerations and Best Practices
- VII. Conclusion
I. Introduction
Looker Studio allows you to create powerful and insightful reports. In this guide, we will focus on creating a calculated field for percentage of total, enabling you to visualise data proportions and compare relative contributions within your Looker Studio reports.
II. Understanding Percentage of Total
Percentage of total is a valuable metric that represents the proportion of individual data points compared to the overall total. This calculation is especially useful when analysing data with multiple dimensions, providing a clearer understanding of each dimension’s relative impact.
III. Creating a Field for Percentage of Total
A. Accessing Data Source and Report
Sign in to your Looker Studio account. Access the Data Source that contains the data you want to analyse. Open or create the Report where you wish to add the “percentage of total” field.
B. Adding a Metric
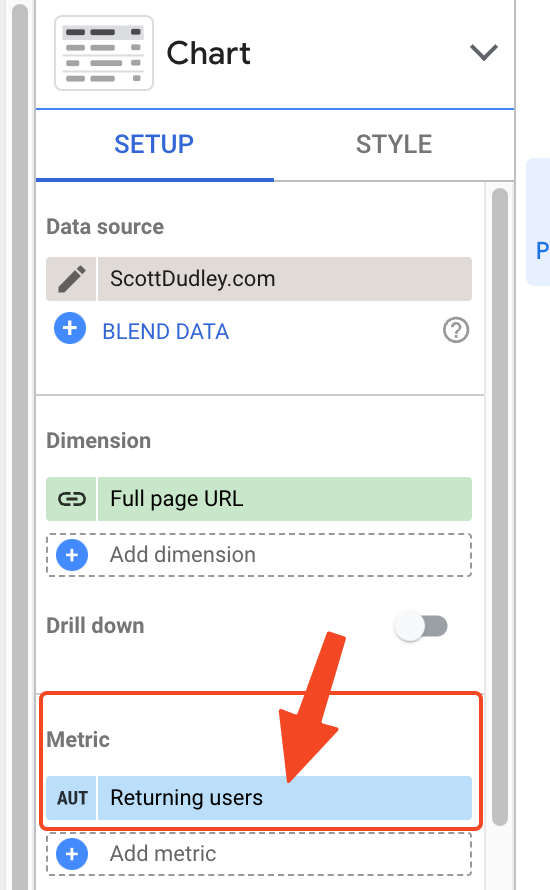
In the Data Source in edit mode, navigate to the Chart settings and the add the Metric that you want to use for “percentage of total”.
C. Adding the “Percent Of Total” to the Metric
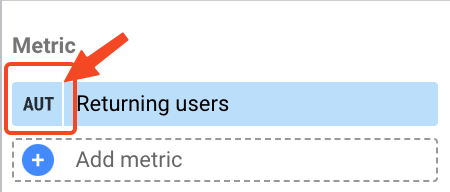
Click on the box to the left of the Metric (that shows “AUT” in my screenshot) to open the advanced settings for the Metric.
Now click on the drop-down in the Comparison calculation.
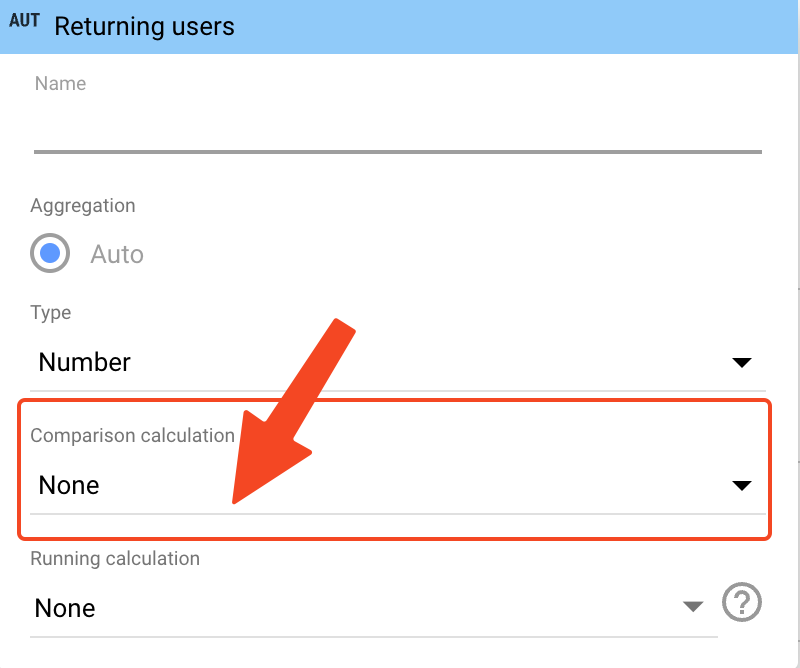
Select the option for “Percent of total”
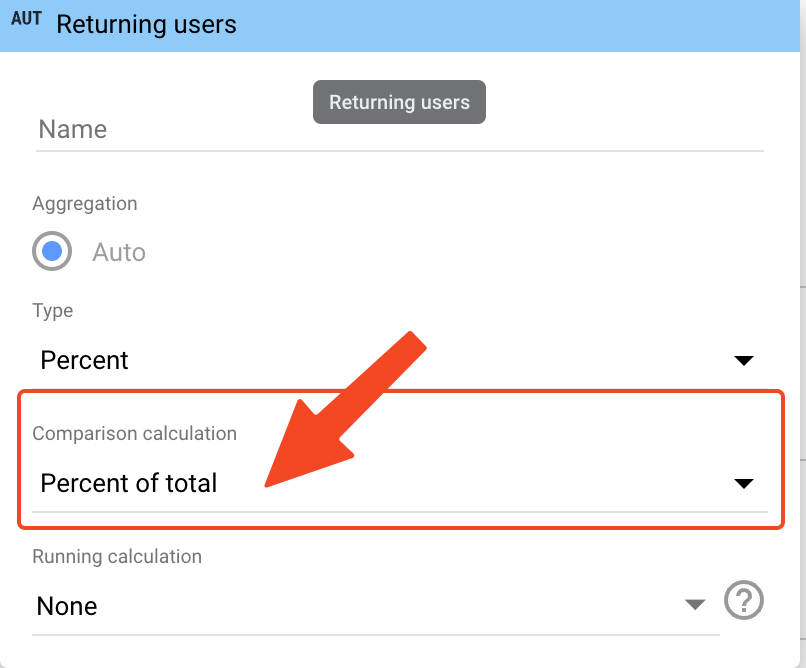
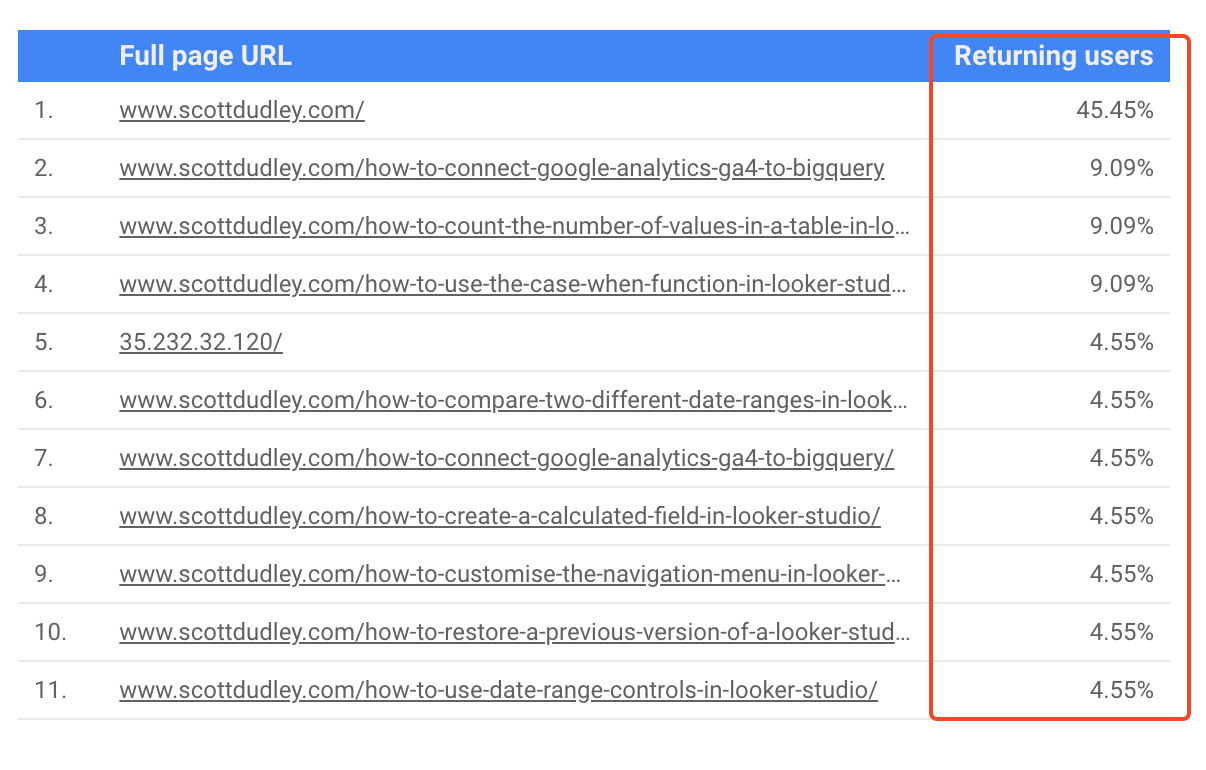
This will automatically change the “Type” option to “Percent” and now the Metric will show up as a percentage of total in your table.
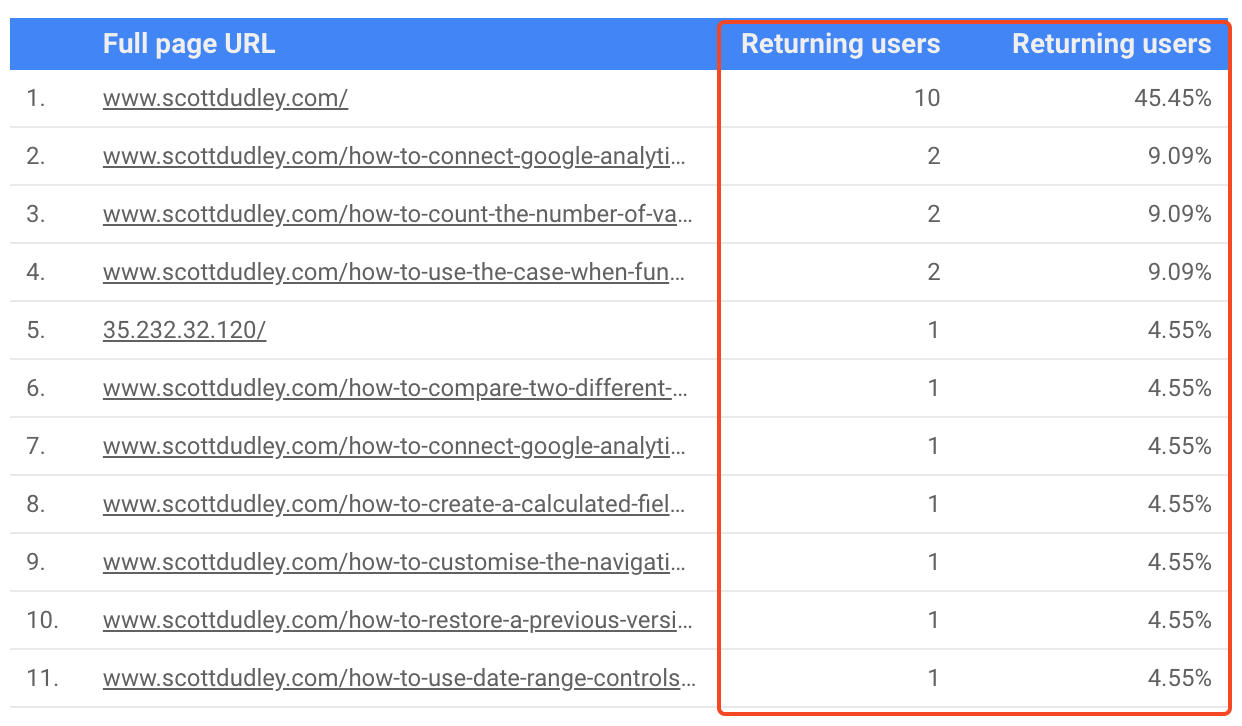
You can also add the Metric again if you want to display both the actual amount and the percentage of total next to each other.
IV. Formatting and Customisation
Select the desired number format for your percentage field (e.g., decimal places and percentage symbol). Customise the data labels and appearance to enhance visualisation in your report.
V. Analysing Data with Percentage of Total
Observe how the percentages adjust dynamically based on the selected dimensions and metrics. Compare the relative contributions of different dimensions and gain valuable insights from the data.
VI. Considerations and Best Practices
- Be cautious when using percentage of total in situations with sparse data, as it may lead to misleading interpretations.
- Consider visualising percentages using charts like bar charts, pie charts, or tables to present data more effectively.
VII. Conclusion
Creating a calculated field for percentage of total in Looker Studio empowers you to analyse data proportions and reveal meaningful insights. By leveraging this powerful feature, you can present data in a more impactful way and make informed decisions based on relative contributions.
Enhance your Looker Studio reports with percentage of total and uncover valuable trends in your data.