Are you ready to uncover hidden insights within your data’s historical patterns? Creating a time series chart in Looker Studio allows you to unveil trends and fluctuations that are crucial for data-driven decision-making.
In this tutorial, I’ll introduce you to the world of time series charts and guide you through the steps to create one, helping you harness the power of temporal data visualisation.
Header Outline:
- I. Introduction
- II. Understanding Time Series Charts
- III. Setting Up Your Data Source
- IV. Creating a Time Series Chart
- V. Analysing Trends and Patterns
- VI. Leveraging Interactive Features
- VII. Considerations and Best Practices
- VIII. Conclusion
I. Introduction
Time series charts are a powerful tool in data visualisation, enabling you to uncover trends and fluctuations over time. In this guide, I’ll show you how to create a time series chart in Looker Studio, empowering you to analyse time-based data and make data-driven decisions with clarity.
II. Understanding Time Series Charts
A time series chart displays data points at specific time intervals, allowing you to identify patterns, trends, and variations over time. This type of chart is particularly useful for tracking changes in metrics such as sales, website traffic, or user engagement.
III. Setting Up Your Data Source
A. Accessing Data and Dimensions
Sign in to your Looker Studio account. Open your Data Source that contains the time-based data you want to visualise.
B. Preparing Time-Related Data
Ensure your data source includes a time-based dimension, such as a date or timestamp field. Arrange your data in chronological order to ensure accurate representation on the time series chart.
IV. Creating a Time Series Chart
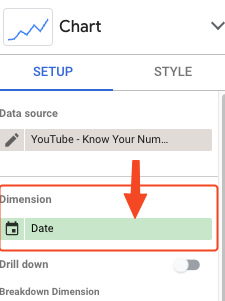
A. Adding a Time Dimension
In your Data Studio report, navigate to the page where you want to add the time series chart. Drag and drop the time-based dimension onto the report canvas.
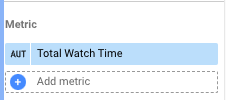
B. Choosing the Metric for Analysis
Drag and drop the metric you want to analyse onto the chart canvas. Looker Studio automatically aggregates the metric based on the time intervals.
C. Customising Time Intervals
Click on the chart to select it. In the “Style” tab on the right panel, customise the time intervals (e.g., days, weeks, months) to suit your analysis.

D. Formatting the Chart
Customise the chart appearance by adjusting colours, labels, and fonts. Experiment with different chart types (line chart, area chart) to visualise data effectively.
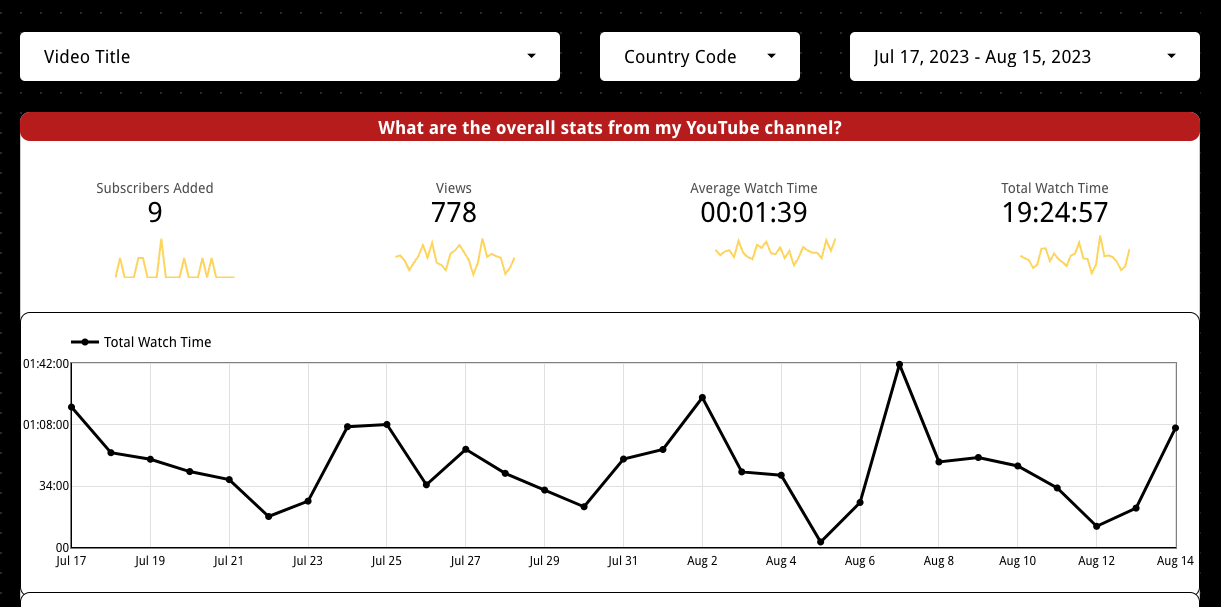
V. Analysing Trends and Patterns
Observe the time series chart to identify trends, spikes, and dips in the chosen metric over time. Use tooltips to view specific data points and metrics for precise analysis.
VI. Leveraging Interactive Features
Enhance interactivity by adding date range controls, allowing users to focus on specific time periods. Incorporate filters to enable users to isolate data segments and explore trends in more detail.
VII. Considerations and Best Practices
- Choose appropriate time intervals based on the frequency of your data.
- Be mindful of data gaps or missing values that could affect the chart’s accuracy.
- Use legends and labels to ensure clarity in data interpretation.
VIII. Conclusion
Creating a time series chart in Looker Studio offers a comprehensive view of trends and patterns in your time-based data. By following the steps in this guide, you can leverage the power of visual analysis to make informed decisions, track performance, and gain valuable insights into your data’s temporal evolution.
Start creating dynamic time series charts today and unveil the stories hidden within your time-based metrics.